Here is a quick script to find Epics without Stories
1. Elevate your privilege to security_admin. 2. In the Left Navigator > Scripts - Background 3. Paste this in the Run Scripts area:
//Find Epics without Stories
(function() {
  var epicList = [];
  var grEpic = new GlideRecord("rm_epic");
  grEpic.query();
  while (grEpic.next()) {
    var gaStory = new GlideAggregate("rm_story");
    gaStory.addQuery("epic",grEpic.sys_id);
    gaStory.addAggregate('COUNT');
    gaStory.query();
    if (gaStory.next()) {
       if (gaStory.getAggregate('COUNT') == 0) {
         epicList.push(grEpic.getValue("number"));
       }
    }
  }
  gs.print(epicList.toString());
})();
Download a collection of administration and maintenance reports contained in a dashboard.
Maintenance Reports. Most ServiceNow instances have common issues that need periodic review. This dashboard includes many of these issues within a single dashboard
Scripted Filter Examples. Many of the reports use a scripted filter, which may be help as examples in building other reports.
Dashboard. You might consider using this dashboard as a starting point and building it out from there. Of course, if there is a report that is not relevant to your organization, just remove it from the dashboard.
Let me know in the comments of any reports to add and I will look into adding them to a later release!
Login as an admin in destination instance. Always deploy into your development instance first and test before installing into production.
Left Navigator Bar > Retrieved Update Sets
Scroll to the bottom, under Related Links, click Import Update Set from XML
Select Retrieved Update Set
Preview and Commit Update Set
Usage
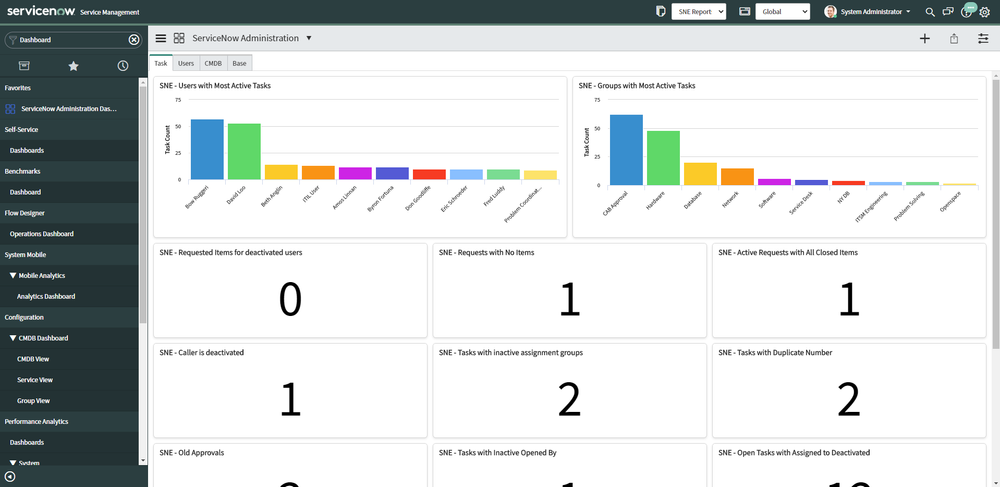
Open the Dashboard: ServiceNow Administration. It has 4 tabs, Task, Users, CMDB, and Base
Tab 1: Task
Active Requests with All Closed Items - Utilizes a scripted filter from the “SNEReports” script include. Cycles through active requests and finds ones with all closed requested items. Stages were not used in a workflow correctly and the Request isn’t being automatically closed when all Requested Items are closed.
Approval on Closed Tasks - The related task to the approval was already closed. The approval is no longer necessary or task was worked on before approval.
Approver is deactivated - The approver was deactivated, so the approval will never complete. Recommend switching the approver to their manager or delegate.
Caller is deactivated - On an incident, the caller on the incident is deactivated. Do you still need to fix the issue, depends on the situation. It may just be the users laptop or it may be an enterprise impacting incident. You may have to switch the caller if the incident still needs resolution.
Groups with Most Tasks - Although a group having the most tasks can either be a positive or negative, it is something to be investigated if it is a dramatic difference between groups
Old Active Tasks - Active tasks over a year old. Consider closing these tasks
Old Approvals - Requested approvals over a year old. You might ask those approvers to approve the request or cancel the request for them
Open Tasks with Assigned to Deactivated - Remove the assigned to person or assign to new user
Requested Items for deactivated users
Requests with No Items - There may be an issue with a record producer or a request was created accidentally. Most often these requests can be closed
Tasks with Duplicate Number - There may have an integration causing this issue, or perhaps a business rule using current.update(), which should be fixed
Tasks with inactive assignment groups - These tasks should be switched to active groups and any jobs or workflow that
Tasks with Inactive Opened By - This is another situation, where the task might not be needed anymore as it was opened by someone that is now left the company
Users with Most Tasks - Although a user having the most tasks can either be a positive or negative, it is something to be investigated if there is a dramatic difference
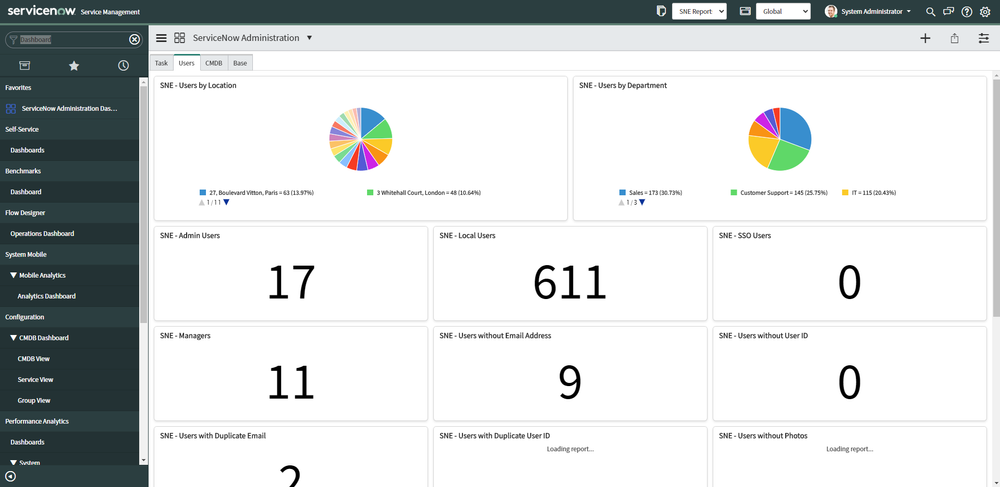
Tab 2: Users
Active Delegates - Usage of the delegate feature in ServiceNow is helpful and you may want to promote that feature within your organization
Admin Users - Recommend keeping the number of admin users to minimum
Local User Accounts - If you have LDAP or SSO, you may consider reducing the number of these accounts
Managers - Shows the number of managers listed in your user directory. This uses a scripted filter to calculate
SSO Users - List of users using SSO or LDAP to login
Users by Department - Pie chart of users by department
Users by Location - Pie chart of users by location
Users with Duplicate Email - This issue might be caused by import that needs adjustment. This uses a scripted filter to calculate
Users with Duplicate User ID - this issue shouldn’t occur anymore due to unique keys, but might happen on instances upgraded from earlier versions of ServiceNow. This uses a scripted filter to calculate
Users without Company - Review if you are using the company field for ACLs or domain-separation
Users without Cost Center - Review if you use the user cost center for certain calculations within SerivceNow
Users without Department - Review if you use the user department for ACLs or certain calculations within SerivceNow
Users without Email Address - If these users are logging or incidents are created on their behalf, an email should be added
Users without Location - Review if you are using the location field for ACLs or other features
Users without Photos - If you are using the LDAP Photo import, this may be helpful for fixing issues with the photo import
Users without Title - Review if you are using the location field for ACLs or Catalog Client Scripts
Users without User ID - These users can’t login without a user id. That might be intentional depending on usage
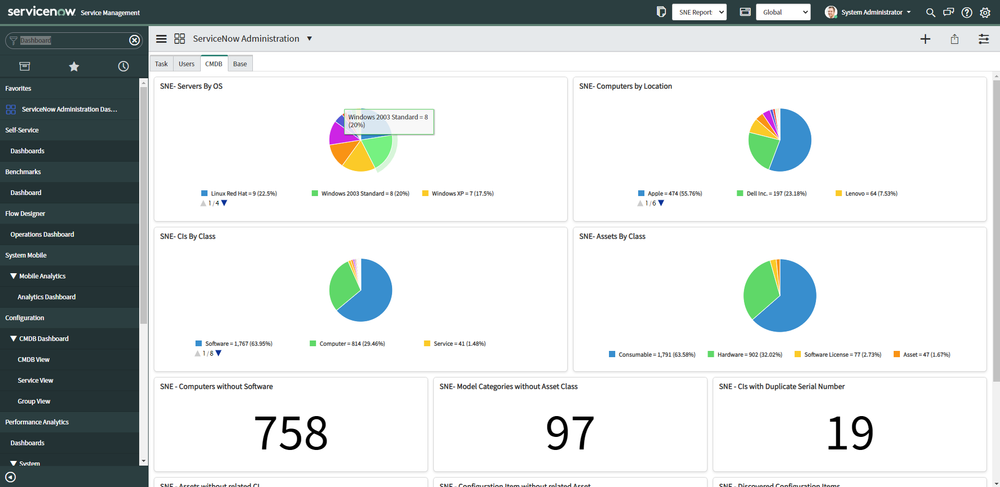
Tab 3: CMDB
Assets By Class - Review if numbers are correct for classes
Assets without related CI - Model categories may need adjustment if this is an issue for these records
CIs By Class - Review if numbers are correct for classes
CIs with Duplicate Serial Number - Duplicate CIs should always be on the lookout for, as they are difficult to clean up.
Computers by Location - Adjust Discovery schedules if data is incorrect
Computers without Software - Helpful when CIs are not being discovered correctly
Configuration Item without related Asset - Model categories may need adjustment if this is an issue for these records
Discovered Configuration Items - This may need adjustment based on discovery sources used
Model Categories without Asset Class - Add asset class to model categories you want the CI class to create a corresponding asset
Servers By OS - Useful when determining what servers need an OS upgrade
These reports below can help determine if companies, cost centers, departments, or locations can be merged or updated
Companies without a related CI
Companies without a related User
Cost Centers without a related CI
Cost Centers without a related User
Departments without a related User
Locations without a CI
Locations without a related User
Locations without a Task
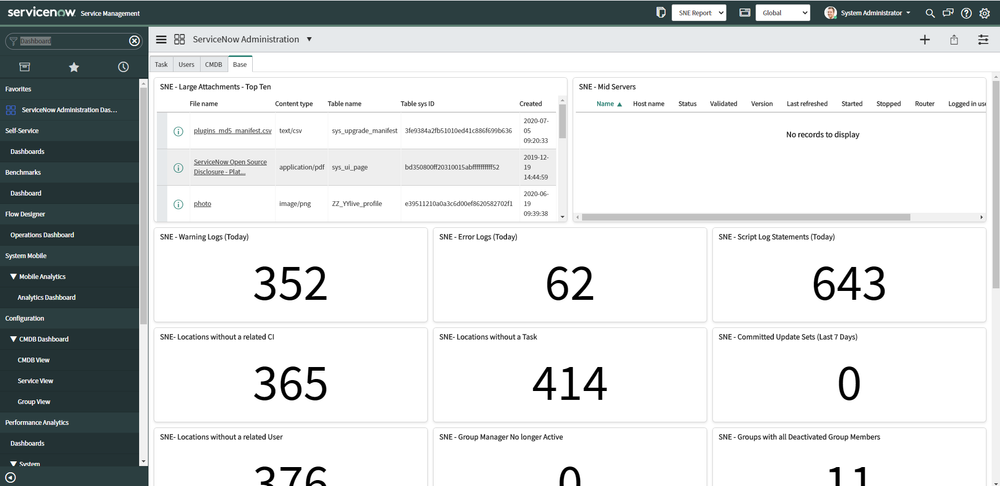
Error Logs (Today) - This report was built by modifying specific report XML, as logs are not available in the reporting application
Expired KB Articles - Change the Valid to date or retire articles
Group Manager No longer Active - Add a new group manager
Groups with all Deactivated Group Members - This group doesn’t have any valid users in it. You may want to deactivate the group or add new group members
Groups without Group Members -
KB Feedback - Respond to feedback and make changes
Large Attachments - Top Ten - You may want to eliminate very large attachments in your instance. This report was built by modifying specific report XML, as attachments are not available in the reporting application
Mid Servers - Check if midservers are operational
Script Log Statements (Today) - Use this report to assist in debugging. This report was built by modifying specific report XML, as logs are not available in the reporting application
Warning Logs (Today) - This report was built by modifying specific report XML, as logs are not available in the reporting application
Workflow with Errors - There is an issue with an workflow and it is not completely correctly
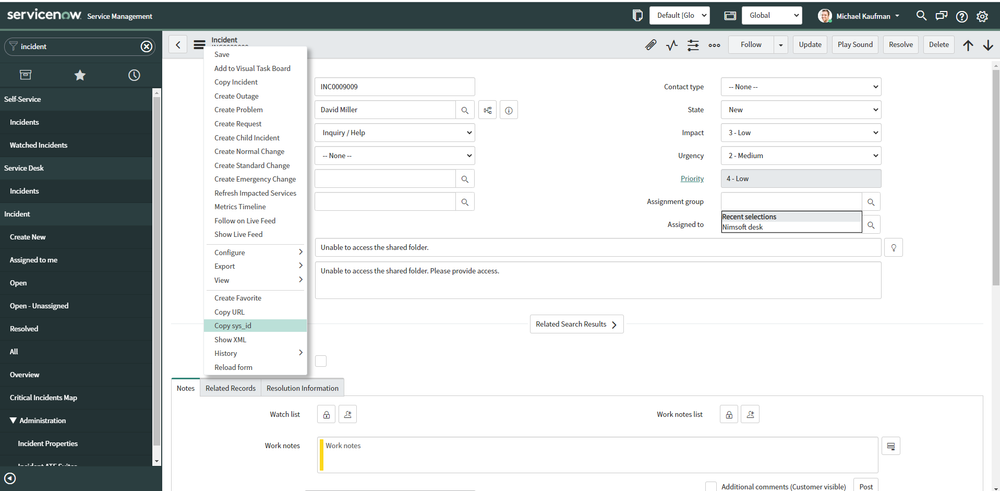
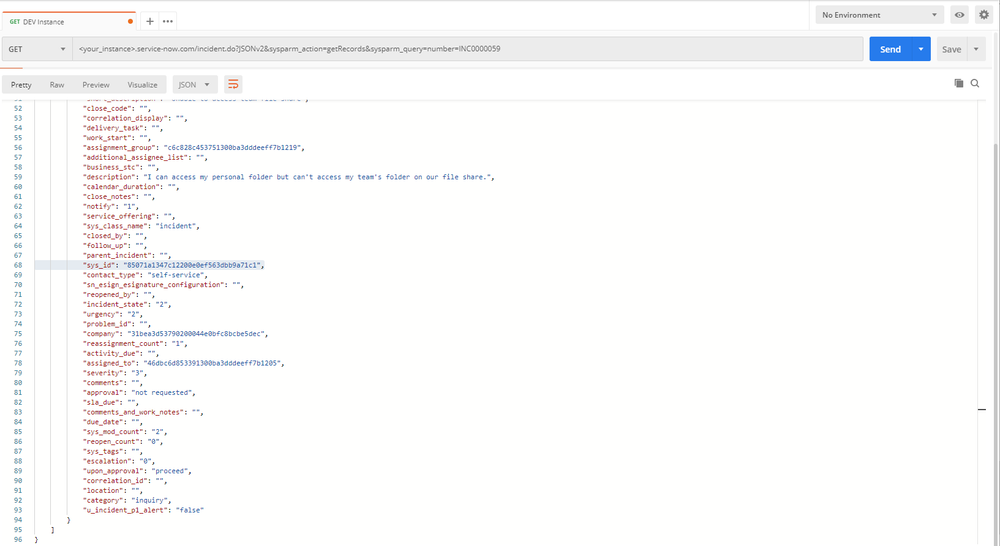
Here is a creative way to use the Easy Import Template to export the sys_id data you are looking for.
Navigate to the list of records where you want to find the sys_id
Build your filter
Right click the header bar and select Import. Alternately you can also click the Hamburger > Import
Do you want to insert or update data? Update
Do you want to create an Excel template to enter data ? True
Include all fields in the template? True or False, your choice
Click Create Excel Template
Click Download
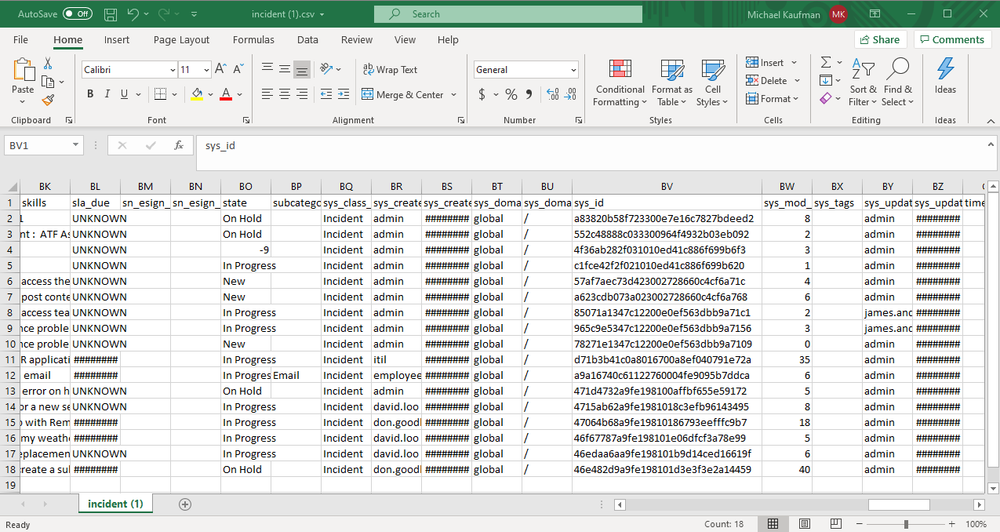
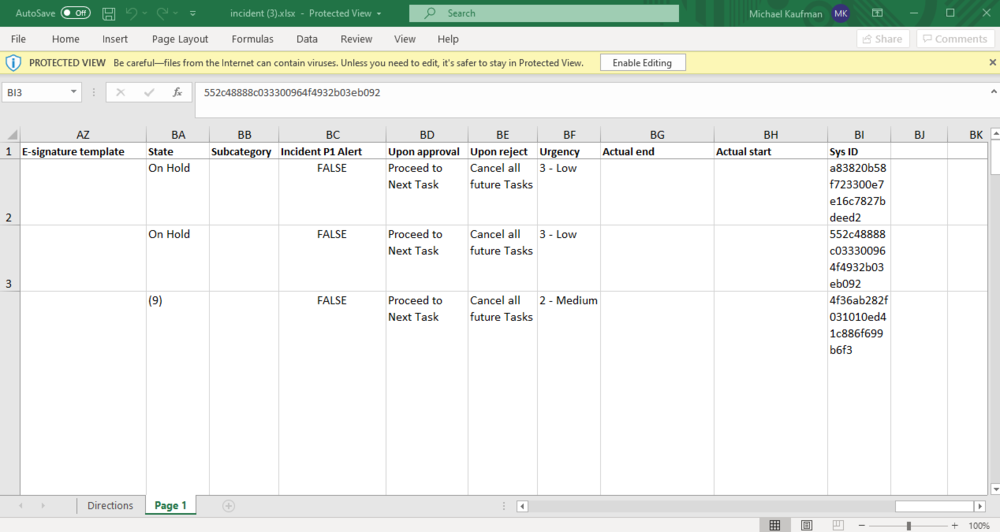
Open the Excel Spreadsheet
Select Page 1
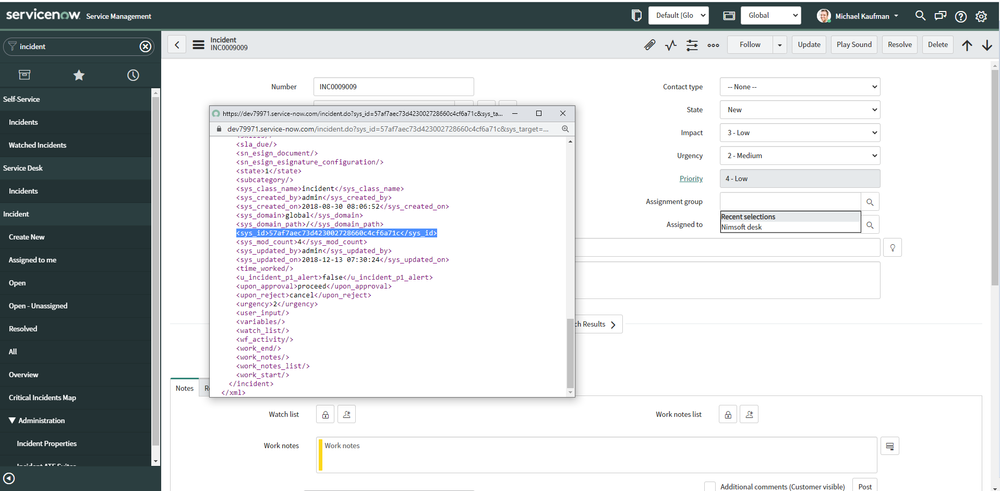
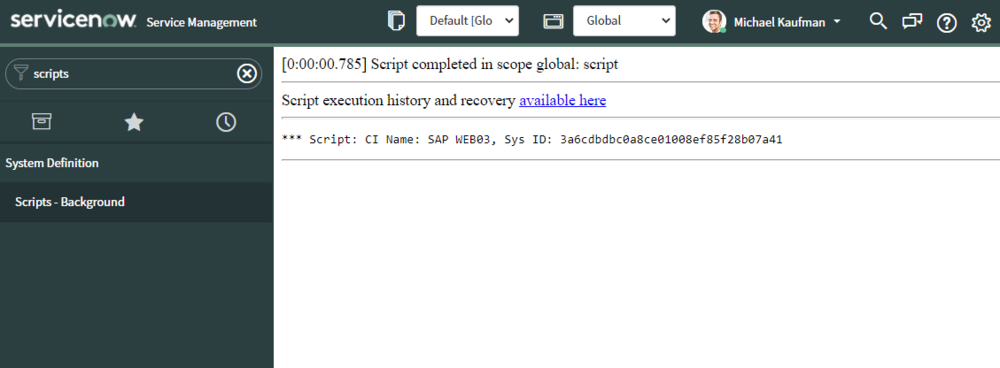
In the far-right column, the sys_id is shown
Example Easy Import Template
9. ODBC DRIVER
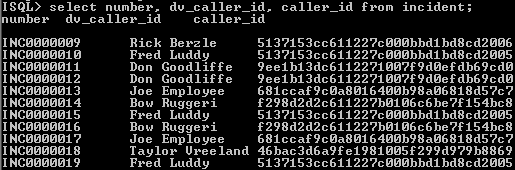
If you are using the ServiceNow ODBC Driver and a reporting tool, you can pull the sys_id field information easily.
Install the ODBC Driver, this guide is helpful. After you install the ODBC Driver, you can run a SQL query and depending on the query, the sys_id can be exported.
However those methods do have limitations, especially when you want email a list of plugins to someone or use it in a ServiceNow application.
Code
(function() {
	var plugins = [];
  var result = 'List of all plugins installed on '+gs.getProperty('instance_name')+'\n';
	var pMgr = new GlidePluginManager();
	var grPlugin = new GlideRecord('sys_plugins');
	grPlugin.addEncodedQuery("active=0^ORactive=1");
	grPlugin.query();
	while (grPlugin.next()) {
		var pluginObj = {};
		pluginObj.name = grPlugin.getValue('name');
		pluginObj.pID = grPlugin.getValue('source');
		pluginObj.isActive = pMgr.isActive(pluginObj.pID);
		if (pluginObj.isActive) {
			plugins.push(pluginObj);
		}
	}
	//sort plugins by name
	plugins = plugins.sort(function(a, b){
		if (a.name > b.name) return 1;
	  if (a.name < b.name) return -1;
	});
	for (var i=0; i<plugins.length; i++) {
		result += plugins[i].name+' | '+plugins[i].pID+'\n';
	}
  gs.print(result);
})();
The Vendor Risk Management (VRM) application provides a centralized process for managing your vendor portfolio, assessing vendor risk and tiering, and for completing the remediation life cycle.
VRM assesses vendors to determine their risk to an organization and guides that process by using a consistent and powerful application.
This article is mostly just my opinion on how to implement VRM, with a small section on usage. Your implementation experience may vary of course.
Overall Process
Setup
Plugin Install
Establish Vendor Portfolio
Define Engagements
Groups and Roles
Assessment Setup
Scoring Setup
Forms, Properties, and Workflow
Reporting
Integrations
Usage
Tier
Assess
Generate Findings
Remediate Issues
Report risks
Monitor
Setup
STEP 1: Plugin INSTALL
The main plugin you will install is GRC: Vendor Risk Management (com.sn_vdr_risk_asmt).
The plugin has various dependencies that will also be installed:
GRC: Profiles
GRC: Compliance Assessment
GRC: Vendor Portal
GRC: Vendor Risk Management Dependencies
Explicit Roles
You’ll want to read about the Explicit Roles plugin if that is not already installed in your instance.
Installing the demo data is helpful when demo’ing the product. However you will want to remove that data before going to production.
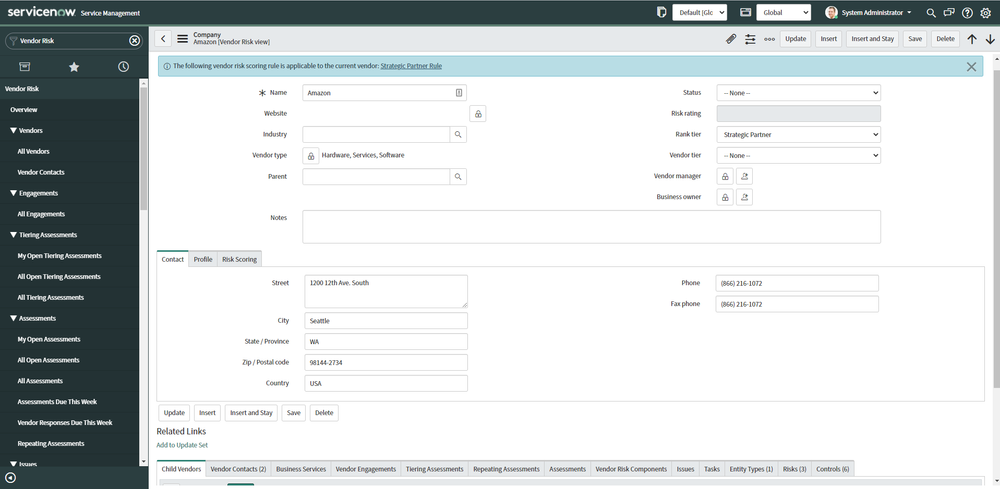
After the VRM plugin is installed, the first place you should look at is the vendor record. It has a number of fields important to the VRM implementation. If you understand this form completely, you can understand a lot about VRM and what it does.
Vendor Record
Fields
Parent
Establishes the vendor hierarchy
Rolls up Risk Ratings to Parent
Status
Example: Prospect, Active, Active Unauthorized, Retired
Vendor Type (Optional)
Type of vendor
Used for classification and reporting
Industry (Optional)
Type of industry
Used for classification and reporting
Risk Rating
The overall risk rating that stems from all of the responses that come from the vendor from assessments (questionnaires and document requests)
Note that individual assessments have risk rating too
Calculated by Vendor Tiering Assessments. Discussed in Step 5: Templates and Scoring
Vendor Tiering is the first step in the VRM Usage Process (Step 7)
Calculated by tiering score to the the vendor tiering scale
Once Tiering assessment is closed, Vendor tier is assigned
Can be used in later assessments to determine the frequency and type of assessment
Can be also set manually
Examples: Critical, High, Medium, Low
Vendor Manager - The employee assigned as the manager to this vendor.
Business Owner
The employees using this vendor in their daily business.
updated automatically based on related business services.
Risk Scoring Tab
Computed risk rating
Shows an average of the vendor risk area risk ratings.
Example: Critical, High, Medium, Low
Override risk rating
Allows you to override the computed risk rating for the vendor.
Once you select the checkbox and fill in the Overridden risk rating and justification, the Risk Rating changes on the vendor form
Assessment risk rating
Shows the calculated risk assessment rating
Example: Critical, High, Medium, Low
Engagement risk rating
Shows the calculated engagement rating.
Example: Critical, High, Medium, Low
Child vendors risk rating
Shows the calculated risk rating for child vendors.
Example: Critical, High, Medium, Low
Related Lists
Child Vendors - This table stores all information fort child vendors. If child vendors are present, their risk ratings are automatically aggregated and shown in the Risk Rating tab on the Vendor form.
Vendor Contacts - This table stores information for all of the vendor stakeholders. Typically, the customer creates one primary vendor contact and one or more secondary contacts. The primary contact adds other users to the list.
Business Services - The Services table is part of the CMDB. It relates the vendors to the services they provide. For example, assume the IT team has a service called “Video Conference Services” that is used for internal employees to communicate internally and with customers. That business service, they have decided, comes from Zoom rather than building anything in-house.
Vendor Engagements - This table stores all engagement information for vendors. If engagements are present, their risk ratings are automatically aggregated and shown in the Risk Rating tab on the Vendor form.
Tiering Assessments - This table stores all tiering assessments performed for the vendor.
Repeating Assessments - This table stores all repeating assessments performed for the vendor.
Assessments - This table stores all assessments performed by the vendor. If vendor risk assessments are present, their risk ratings are automatically aggregated and shown in the Risk Rating tab on the Vendor form.
Vendor Risk Components - This table stores all vendor risk components. If vendor risk components (that is, assessments, engagements, or child vendors) are present, their risk ratings are automatically aggregated and shown in the Risk Rating tab on the Vendor form.
Issues - This table stores all issues performed for the vendor.
Tasks - This table stores all tasks performed for the vendor.
STEP 2: Establish VENDOR PORTFOLIO
import vendors
How to import vendors:
Excel spreadsheet - System Import Sets > Load Data.
Third-party onboarding system
Vendor table - ServiceNow data from Procurement, CMDB, or Vendor Performance
Manual
When importing vendors, you can also import additional new fields that the customer may need as well. Some fields such as Vendor Tier can also be imported rather than have Tier Assessments.
SETUP VENDOR HIERARCHY
If you work with vendors who have subsidiaries (or sub-subsidiaries) that pose potential risk to your business, you can create vendor hierarchies by setting up parent-child relationships between parent vendors and all of their children.
This involves setting up the Parent field on the vendor and/or the Child Vendor Related List
You can then perform assessments at each of the individual companies and roll up the results to calculate an overall risk score for the parent vendor.
Vendor contacts go through a similar import process like the vendor import
How to import vendors contacts
Excel spreadsheet - System Import Sets > Load Data.
User table - ServiceNow data from CSM, CMDB, or Vendor Performance
Manual
Setup Business Services (Optional)
You may have existing business services to apply to the vendor, which can be applied in the Related List Business Services on the Vendor form
The Business Owner field on the Vendor Form is updated automatically based on related business services.
STEP 3: Define Engagements
Engagements are any products or services offered by a vendor that can be assessed as part of the vendor risk assessment process. As engagements are defined, you can define primary and secondary contacts for both vendors and engagements.
Engagements also work with Vendor Hierarchy. Engagements represent products or services provided to the parent vendor, either directly or from child vendors, which you can assess for risk. In the case where a child vendor provides engagements, the risk scores assigned to the engagements are rolled up to calculate the risk score of the child vendor, which in turn rolls up to the parent.
Examples of Engagements: Laptops from HP, Software from Adobe, HR Software from Workday
Fields
Type
From GRC Choices Table: Software, Consulting, Hardware, Service Outsourcing, Staff Outsourcing, Other
Start/End Date - Engagement Start/End Date
State
Example: Prospect, Active, Active Unauthorized, Retired
Risk Rating
The overall risk rating that stems from all of the responses that come from the vendor from assessments (questionnaires and document requests)
Examples: Critical, High, Medium, Low
Engagement tier
Calculated by Tiering Assessments. Discussed in Step 5: Templates and Scoring
Calculated by tiering score to the the vendor tiering scale
Once Tiering assessment is closed, Engagement tier is assigned
Can be used in later assessments to determine the frequency and type of assessment
Can be also set manually
Examples: Critical, High, Medium, Low
Value
Engagement manager - List of vendor managers
Business Owner
The employees using this vendor in their daily business.
updated automatically based on related business services.
Risk Scoring Tab
Computed risk rating
Shows an average of the risk ratings.
Example: Critical, High, Medium, Low
Override risk rating
Allows you to override the computed risk rating for the vendor.
Once you select the checkbox and fill in the Overridden risk rating and justification, the Risk Rating changes on the form
As a minimum, you should setup a Vendor Risk Manager group or assign roles to an existing similar group, so the the client can use VRM. This group would likely have the sn_vdr_risk_asmt.vendor_risk_manager role.
Organizations use vendor tiering to classify their vendors into categories of potential risk posed at the time of on-boarding. The vendor tier is based on a pre-defined scale from the tiering assessment score. The Vendor Tier is calculated based on a questionnaire provided to assessors.
Vendor risk assessments are sent to vendors to determine the risk they pose. Assessments may happen during the early stages of the procurement process to help select the best qualified vendor from a pool of candidates, but it is also recommended to do this on a continuous basis on existing vendors to determine their long-term viability as a partner.
Use the tier-based assessment submission rule to trigger a risk assessment from any changes to the vendor tier.
Fields
Vendor - Name of the vendor to apply the rule.
Tier
Select the tier scale which will automatically generate the risk assessmentvendor risk can override this value.
Examples: Critical, High, Moderate, Low, Minor
Assessment Template - Template that will be sent when the risk tier scale changes to the tier specified in the rule.
Auto submit to vendor - Automatically submit the risk assessment to the vendor after it has been generated. If this is not selected, the assessment stays in Draft after being created.
Score Based Submission
You can create rules to automate the vendor risk assessment functionality based on a change to the vendor's security score.
Risk Area ties Criteria, Definition, Scoring Method, and Weight
Risk areas are used to define the types of risk you want to assess for your vendors. For example, you may want to assess vendors in terms security or financial risk, or risk to reputation. Each of these can be defined as a vendor risk area.
Risk Area Criteria
After you have defined vendor risk areas, you can define risk area criteria to group different risk areas based on the types of vendors you work with. Within criteria definitions, you can adjust the weight of each grouping.
Define risk area criteria to group different risk areas based on the types of vendors you work with. When you define risk area criteria, the scoring method and weight are copied from the risk areas. These values can be overridden, as needed.
In Risk Area Criteria, you setup different risk areas which have a scoring method and weight
Risk Area Definition
Risk is often calculated by examining the impact and likelihood of potential loss caused by an event or action. You can better understand the risk your vendors pose to your business by defining the different areas of their business that they want to assess for risk.
Definitions include fields: Default Scoring Method and Weight
Component Definition and Criteria
Components are the entities for which you can assess risk. The base system comes with three components:
Child Vendors
Engagements
Vendor Risk Assessments
Although you cannot add new components or modify existing ones in version 10.1, you can define the criteria (in terms of scoring method and weight) to be used to assess these components.
Component Definition
entities for which you can assess risk. Risk is calculated for each component, then the risk is aggregated and rolled up to calculate vendor risk ratings.
Definitions include fields: Default Scoring Method and Weight
Component Criteria
Changes made to Component Criteria (for example, adding or deleting a component) may affect the risk rating score calculation for the vendor that this criteria applies to. The risk rating for impacted vendors can be recalculated by clicking the "Recalculate risk rating" button on the vendor form.
Scoring Rules (Engagement and Vendor Risk)
Define criteria used by the system to determine which vendors require assessments based on their risk scores.
Security rating scores reflect an organization’s cybersecurity posture. Similar to personal credit scores, they provide insight on how trustworthy and safe a particular vendor can be, especially if you know that they may be handling sensitive data.
Most clients will have certain fields to add to the vendor form as part of the vendor portfolio import process
Access Control
Here are a few customizations to Access Control to consider
Remove ITIL User ability to create and delete vendors
If you have users with the user_admin or vendor_editor roles, you may want to adjust some ACLs to control access to certain fields used on the Vendor [core_company] form.
Vendor Portal Modification
There is a System Property, sn_vdr_risk_asmt.company.name, that sets the Company name for messages. You’ll want to change this.
Turning off functionality. I’ve seen in a lot of these implementations where functionality like “Issues” is turned off as the client doesn’t want to use it
Branding - The Vendor Portal uses Service Portal functionality so you can brand it for your organization
Navigation - I have written some widgets to provide navigational help when performing assessments
Two Portals
If you are using an earlier version of ServiceNow, you may be using the older (non-scoped) portal
Old Portal /vdp
New Portal /svdp
sn_vdr_asmt.vendor_portal_endpoint system property controls which portal is in use
to adjust the SSO, adjust the svdp_login page
Notifications
The Paris version of ServiceNow includes 17 notifications
They use mail scripts. Be comfortable with mail scripts before you recommend they are “easy” to modify. :)
You may need to add notifications for when certain records are assigned to groups
ServiceNow includes many script includes that calculate scoring and assessments. I would highly advise not changing those as they are improved with upgrades
However real life dictates you must meet requirements. Unless you can smoothly talk the customer out of changing the code. :)
I try to use Business rules to work around these issues to avoid extending the script includes. These business rules can be easily turned off if not needed in the future
Properties
There are a number of system properties that start with sn_vdr_risk_asmt to view. However here are two I often modify:
sn_vdr_risk_asmt.company.name - This property sets the name when an a Vendor contact submits an assessment. It is defaulted to “ServiceNow”. You’ll likely want to change this.
ServiceNow includes 20 reports in the Paris release
Quick Start Tests
If you are using the Automated Testing Framework (ATF) framework, ServiceNow provides four entire suites to get you started testing VRM. Super helpful actually.
GRC: Create Engagement Assessment - Creates and submits an engagement risk assessment to an engagement.
GRC: Create Vendor Assessment - Creates and submits a vendor risk assessment to a vendor.
GRC: Vendor Portal - Answer and Return Assessment - Vendor contact answers and submits assessment in the Service Vendor Portal.
GRC: Vendor Tiering Assessment - Selects and submits an assessment to respective assessors after changing the duration.
Step 9: Integrations
GRC Integration
VRM integrates with the Policy and Compliance, and Risk applications in ServiceNow
Policy and Compliance
Associate Control Objectives with specific questions in questionnaires
Controls marked automatically as non-compliant or compliant
Risk
Automatically adjust calculated risk score for vendor
VRM Usage
Tier
This step is optional, as Vendor Tier can be setup manually on the vendor record. However this process seems common in my experience for VRM implementations, where a tier assessment (or internal rank) is supplied by internal stakeholders (assessors).
Organizations use vendor tiering to classify their vendors into categories of potential risk posed at the time of on-boarding. The vendor tier is based on a pre-defined scale from the tiering assessment score. The standard tiers are None, Critical, High, Moderate, Low, and Minor. Each tier has different assessment questions and document requests associated to them.
Most organizations import their vendor portfolio through an excel spreadsheet or an integration with another onboarding solution. Vendor risk managers make on-going updates to the vendor information, including risk security scores and vendor tiering scores.
The vendor risk manager or vendor risk assessor determines the risk tier or categories of risk exposure for the vendor.
The vendor risk manager selects the vendor, assigns the tiering questionnaire template, and assigns the internal assessor that is required to complete the assessment.
Internal stakeholders navigate to Self-service > My Assessments and Surveys > to complete and submit the assessment.
After assessors have responded to the questionnaire, the tiering score is calculated from an average of all scores. This tiering score is measured against the vendor tiering scale and when the assessment is closed, the tier is assigned to the vendor. The responses to these tiering assessments are calculated and the risk tier is assigned. The vendor risk manager can initiate the risk assessment or one can be automatically sent using a configured business rule.
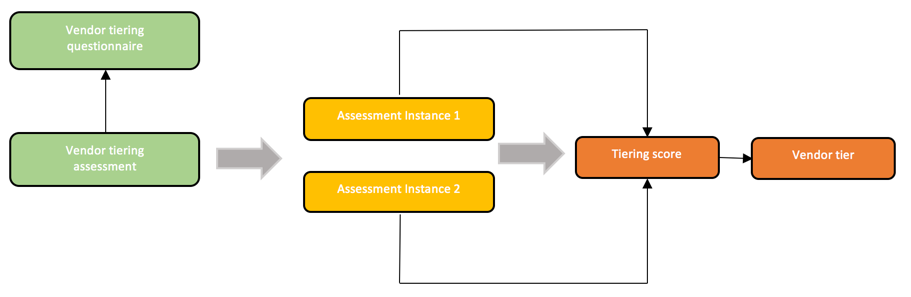
Vendor Tiering Process
The tiering assessment initiates one assessment instance for each assigned assessor. The assessor sees only the sections assigned to them based on their role.
The response scores from all assessment instances are averaged to provide the tiering score.
The tiering score is mapped to the vendor tiering scale providing the vendor tier.
This tier is assigned to the vendor when the tiering assessment is closed.
Security Scores
Starting in version 10.1.3, each third-party risk score provider can now have multiple scoring services. Each scoring service can be a set of number ranges, in ascending or descending order, or a set of ratings. Third-party scores are automatically mapped to the normalized scores and normalized ratings in Vendor Risk Management.
Third-party scores can also contribute to the final score/rating of vendors. Provider-based submission rules can be defined to monitor the third-party risk score changes. When the rules are triggered, a series of actions can be taken automatically, such as creating and sending an assessment, issue, or task.
After third-party provider scores have been added to a vendor, the External Risk Rating appears on the Vendor form. You can modify the default scoring method and/or the default weight on the Component Definition form. The Default scoring method can be modified to define how multiple scores for each risk area are calculated.
Assess
Setup and Generate Assessments
Vendor risk assessments are sent to vendors to determine the risk they pose. Assessments may happen during the early stages of the procurement process to help select the best qualified vendor from a pool of candidates, but it is also recommended to do this on a continuous basis on existing vendors to determine their long-term viability as a partner.
Using IP range based authentication, you can control access by IP address and block access to a specific address or range of addresses that you suspect belong to malicious individuals
Often companies use IP Range Based Authentication to restrict access to ServiceNow to only within their internal network. Although this is a powerful security restriction, it does limit the functionality of ServiceNow. Mobile usage and remote usage won’t be possible unless users login into your network via VPN.
IP Range Based Authentication or “IP Address Access Control” is installed by default on new ServiceNow instances using New York.
This article documents a process to setup IP Range based authentication to your ServiceNow instance.
STEP 1: GATHER Allowed IP ranges
Gather a list of ip addresses to allow on your ServiceNow instance. By default IP Address Access Control is empty, meaning that there are no restrictions on access to your instance.
Personal External IP Address
First thing I do is find my own external ip address, and use that as first to allow.
Open internet browser
Go to www.google.com
Google what is my ip address
Result is displayed
Please note that the system won't let you lock yourself out, so if you try to add a rule such that your current address would be locked out, the system warns you and refuses your insert.
Company IP Range
Ask your network admin what range of ip addresses your company uses.
Vendor IP Range
Also consider is any integrations used outside of your company. You may have to look at the Transaction Log to see what IP address the integration is using. You may have to also contact the outside vendor for this IP Address range. This isn’t always so easy if the vendor doesn’t exactly know what IP range they have.
Contractor IP Range
If you have contractors that work at home without an vpn, you’ll want to add their IP addresses or get them on the vpn.
ServiceNow Instances
Look up all the ServiceNow instances used at your organization and their IP address. To ensure that IP Address Access Control does not cause update sets to fail, add the target instance as an exception on the source instance.
Viewing IP and datacenter information HI Service Portal
Using the IP Addresses you gathered in Step 1, add them to the ServiceNow allow ranges
Allow IP Address
Login as an admin
Navigate to System Security > IP Address Access Control to see a list of your IP access controls.
Click New
Type: Allow
Range Start: 64.236.16.0 (Example)
Range End: 64.236.16.235 (Example)
Click Submit
Repeat for the ranges needed.
STEP 3: Deny All
After you have entered all the allowed ip addresses, block all others not listed.
Allow rules always supersede deny rules. So if an address is both allowed (by one rule) and denied (by a second rule) it is, in fact, allowed.
Deny all
Login as an admin
Navigate to System Security > IP Address Access Control to see a list of your IP access controls. Type: Deny Range Start: 0.0.0.0 Range End: 255.255.255.255
Click Submit
Note that you can deactivate the Deny All entry if troubleshooting a 403 error.
STEP 4: Find denied IP Addresses
A user whose access is restricted based on an access rule gets a 403 error on their browser.
You may have missed some allowed IP addresses in step 2. Checking in the node log allows you to see any ip addresses that are receiving the 403 error.
How to check the Node Log
Login as an admin
Navigate to System Logs > Utilities > Node Log File Browser..
Browse the logs by criteria, such as time period and message.
You can also download log files when you know which log you are looking for, by navigating to System Logs > Utilities > Node Log File Download.
Log entries for blocked IP address appear as follows:
One features of ServiceNow you may have missed is the ability to utilize Related List Queries (RLQUERY) using GlideRecord.
What is RLQUERY?
Related List Query is something you can add to an Encoded Query to query a child table within one GlideRecord query.
RLQUERY is what Related List Conditions in reports use. If you build a report with Related List Conditions, and then view the report’s xml, you can see the filter field it is using RLQUERY.
The value of using RLQUERY over other methods like GlideAggregate is uncertain for me. Seems fast and easy to use once you understand it. It is an interesting new way to make queries.
RLQUERY BUILD TRICK
Here is a good way to build scripts using RLQUERY without having to understand RLQUERY that well.
Build a report using Related List Conditions
Reports > Administration > All
Open the Report
Hamburger > Show XML
View the “filter” field in the xml
Use that RLQUERY in your script.
Below are some examples using RLQUERY.
Example 1: Active Incidents with Affected CIs
(function() { var incidents = []; var grIncident = new GlideRecord("incident"); grIncident.addActiveQuery(); grIncident.addEncodedQuery('RLQUERYtask_ci.task,>=1,m2m^ENDRLQUERY'); grIncident.query(); while (grIncident.next()) { incidents.push(grIncident.getValue("number")); } gs.print('Active Incidents with Affected CIs: '+incidents); })();
Example 2: Incidents WITHOUT SLAS
(function() { var incidents = []; var grIncident = new GlideRecord("incident"); grIncident.addEncodedQuery('RLQUERYtask_sla.task,=0^ENDRLQUERY'); grIncident.query(); while (grIncident.next()) { incidents.push(grIncident.getValue("number")); } gs.print('Incidents without SLAs: '+incidents); })();
Example 3: Groups without Group Members
(function() { var groups = []; var grGroup = new GlideRecord("sys_user_group"); grGroup.addActiveQuery(); grGroup.addEncodedQuery('^RLQUERYsys_user_grmember.group,=0^ENDRLQUERY'); grGroup.query(); while (grGroup.next()) { groups.push(grGroup.getValue("name")); } gs.print('Groups without Group Members: '+groups); })();
Sorry I haven’t posted in a long time. Been working on projects and taking ServiceNow deltas/mainline exams. One certification I want to get is the Performance Analytics certification. Since I’ve used PA for 5-6 years, I think I am ready. However it isn’t called Performance Analytics anymore? It is now called Platform Analytics. What?
Let’s breakdown this big change in Xanadu. The text in italics is detail from ServiceNow release notes.
Reporting DISAPPEARS
Reporting is not available on new instances. Use Platform Analytics data visualizations with table data sources instead. Users with admin and report_admin roles will still be able to use Reporting for Service Portal.
Remember all those thousands of reports you created over the years. Some people even refusing to use the new reporting interface. :)
Well you’ll never make a report that way again. Platform Analytics merges Performance Analytics and Reporting. The new Platform Analytics is way better and more powerful. Also having all the reporting in one place makes a lot of sense. I really do like it.
What happens to all those old reports? There is a migration process.
When you migrate your Core UI data, your existing dashboards, reports, interactive filters, and Performance Analytics widgets are moved to Platform Analytics. When you activate the migration, the result is a single set of visualizations and unified filters for all data sources.
What is migrated?
The short answer is that almost everything is migrated. Most Core UI dashboard content is supported in Platform Analytics. Some content doesn’t have an analogous Platform Analytics feature and is migrated into containers, also called iframes. This is called Compatibility mode. For detailed information about content migrated into iframes and the few items that aren’t migrated at all, see Content not migrated or migrated in compatibility mode.
For compatibility mode reports, I did build some things in iFrames, and a lot of workbenches. The other items listed, not very often.
Performance Analytics Widgets Not Available
Performance Analytics widgets are not available on new instances. Use Platform Analytics data visualizations with indicator data sources instead. Users with the admin and pa_admin roles will still be able to use Performance Analytics widgets for Service Portal.
What does this mean? Platform Analytics widgets are what you used to place on a dashboard, which displayed indicator information. Instead of using widgets, now you use Data Visualizations.
Data visualization are much more powerful than the old widgets. You can create a data visualization against an indicator, directly to a table, or probably lots of other data sources in the future. Data visualizations help combine Performance Analytics and classic reporting.
Analytics Hub Gone
The Analytics Hub is not available on new instances or instances that have fully migrated to Platform Analytics. Use KPI Details instead.
What does this mean? KPI Details is built with a workspace and I think it looks better. One thing to note when you view an indicator, and want to see how it looks with Analytics Hub, you used to click “View in Analytics Hub” under Related Links. Instead now you click “Explore indicator” instead, and pulls up KPI Details instead.
Admin Console Discontinued
The Performance Analytics admin console is deprecated on new instances. For upgrading customers, the console is available but does not show data from the new Platform Analytics artifacts.
What does this mean? I never used the Admin console. I just clicked indicators, breakdowns, etc in the Left navigator. There is a new workspace called “Analytics Center” which shows all your dashboards and data visualizations you bookmarked. I think you’ll want to use the new bookmark functionality, especially on ServiceNow instances with a lot of dashboards.
Responsive dashboard AND Interactive Filters REPLACED
Responsive dashboards are not available for new customers. Create dashboards in Platform Analytics instead.
Interactive filters are not available for new customers. Create filters in Platform Analytics instead.
This is covered under the migration process, in that your old dashboards and interactive filters are migrated. Creating dashboards this new way is simple if you use the new In-line Editor. It’s drag and drop and has more features than the old dashboard editor.
Want to build a more powerful dashboard? Use the dashboard technical editor which uses UI Builder.
Are you scared of the UI Builder? I kind of was, but then I took the new Xanadu UI Builder Fundamentals on NowLearning. It really explains how the UI Builder works in-depth. I recommend all ServiceNow developers take the class. Trying to “wing-it” with the UI Builder doesn’t really work, you gotta take the class.
Conclusion
Why do I have to learn another new thing? Why can’t things just stay the same? That’s never going to work, you must keep current if you want to be the best.
Platform Analytics is great. Just take the first step and start learning it.